
Inflationary Pressures in 2026: Expert Breakdown of 3.5% Impact on US Consumer Spending
This article analyzes the projected 3.5% annual inflation rate in 2026 and its significant implications for U.S. consumer spending, offering expert perspectives and actionable advice for navigating economic changes.
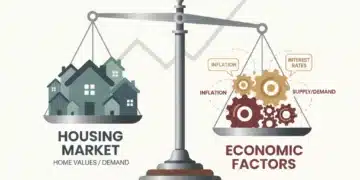
Real Estate Market Rebalancing: 4 Economic Factors Driving a Projected 7% Shift in U.S. Housing Prices During 2026
The U.S. housing market is poised for a significant rebalancing by 2026, with a projected 7% shift in prices. This in-depth analysis examines the four primary economic factors driving this trend: interest rates, inflation, housing inventory, and evolving demographic shifts.

US Consumer Sentiment Q1 2026: A 3-Point Rise Signals Economic Confidence
The first quarter of 2026 has seen a notable 3-point increase in US Consumer Sentiment, suggesting growing economic confidence among American consumers. This article delves into the factors contributing to this positive trend, its broader economic implications, and what it means for businesses and policymakers.

Global Economic Headwinds 2026: Key Factors Affecting US Economy
The US economy in 2026 faces significant global economic headwinds. This post analyzes two critical international factors: intensifying geopolitical tensions and persistent global supply chain vulnerabilities, offering insights into their potential impact.